How Checkly tracing works under the hood
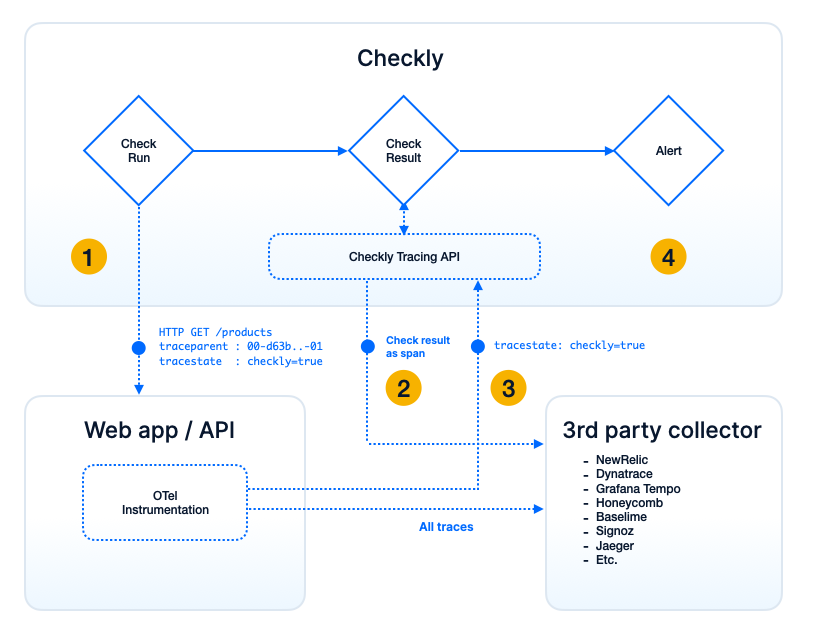
To help you understand how the Checkly OpenTelemetry integration works, have a look at the diagram below that details the (possible) dataflows and how they connect to Checkly’s monitoring and alerting pipeline.
-
When enabling the integration, Checkly will automatically instrument all HTTP requests made by your checks with
traceparentandtracestateheaders. These HTTP requests hit your web application and / or API as normal.We do this for all of our synthetic check types, including API, Browser and Multistep checks. For the
traceparentwe generate a W3C compliant trace ID for each HTTP request that is part of a check. This means that for Browser checks and Multistep checks, there can be multiple requests instrumented.Similarly, we add the
tracestateheader to identify Checkly as the vendor that generated the trace by setting it tocheckly=true. Together with thetraceparentheader, these headers are used to propagate the trace context along the request chain.This is the most basic way of tying a synthetic check to your backend traces. It will however not give you a ton of context about the check run itself, like the check name, location etc.
-
You can configure your 3rd party backend in the Checkly UI, so we can also send every check result as a span to your backend. The result is that now all backend spans are correlated to the check run that triggered them, together with a full context of the check run, like the run location, check name, check type etc. These items are stored in the
checklynamespace as attributes on the span i.e.checkly.check.name: "ACME homepage" checkly.check.id: "438481ea-0eab-43d6-8932-ab51bd0d49d6" checkly.check.type: "browser" checkly.check.location: "eu-west-1"
Step 3 and 4 are what really kicks Checkly’s OTel integration into high gear, and it works even if you do not have a 3rd party OTel backend already set up.
-
By adding the correct OTel libraries and some simple extra filter statements, you can send ONLY the traces related to your Checkly checks back to Checkly. We ingest these traces on one of our endpoints, e.g.
otel.eu-west-1.checklyhq.com/v1/tracesand display them in the Checkly UI, right next to your check results.No 3rd party backend needed. 😲
Checkly’s trace ingestion endpoint is a standard OTel backend endpoint, but we only accept traces that are related to synthetic checks, e.g. those marked with
tracestate: checkly=true. This way, you can keep your OTel setup lean and mean and still get all the benefits of correlating check results with backend traces. -
When your check breaks, you can get an alert that points to a check result. This result now contains a full trace of the check run, including all backend spans. This allows you to quickly identify the root cause of the issue, without having to jump to other tooling or dashboards.
Last updated on May 14, 2024. You can contribute to this documentation by editing this page on Github