Express
This guide will help you instrument your Express application(s) with OpenTelemetry and send traces to Checkly.
The steps are largely the same as instrumenting any Node.js application with OpenTelemetry.
Step 1: Install the OpenTelemetry packages
Install the relevant OpenTelemetry packages:
npm install --save \
    @opentelemetry/sdk-node \
    @opentelemetry/exporter-trace-otlp-proto \
    @opentelemetry/auto-instrumentations-node \
    @opentelemetry/sdk-trace-base \
    @opentelemetry/api
Step 2: Initialize the instrumentation
Create a file called tracing.js at the root of your project and add the following code:
// tracing.js
const { NodeSDK } = require('@opentelemetry/sdk-node')
const { OTLPTraceExporter } = require('@opentelemetry/exporter-trace-otlp-proto')
const { getNodeAutoInstrumentations } = require('@opentelemetry/auto-instrumentations-node')
const { BatchSpanProcessor, SamplingDecision } = require('@opentelemetry/sdk-trace-base')
const { trace } = require('@opentelemetry/api')

const exporter = new OTLPTraceExporter({
  timeoutMillis: 2000,
})

const sdk = new NodeSDK({
  instrumentations: [getNodeAutoInstrumentations()],
  spanProcessors: new BatchSpanProcessor(exporter),
  sampler: {
    shouldSample: (context, traceId, spanName, spanKind, attributes, links) => {
      const isChecklySpan = trace.getSpan(context)?.spanContext()?.traceState?.get('checkly')
      if (isChecklySpan) {
        return { decision: SamplingDecision.RECORD_AND_SAMPLED }
      } else {
        return { decision: SamplingDecision.NOT_RECORD }
      }
    },
  },
})

sdk.start()

process.on('SIGTERM', () => {
  sdk.shutdown()
    .then(() => console.log('OTel Tracing terminated'))
    .catch((error) => console.log('Error terminating OTel tracing', error))
    .finally(() => process.exit(0))
})
Notice the sampler configuration. This is a custom, head-based sampler that will only sample spans that are generated by Checkly by
inspecting the trace state. This way you only pay for the egress traffic generated by Checkly and not for any other traffic.
Step 3: Start your app with the instrumentation
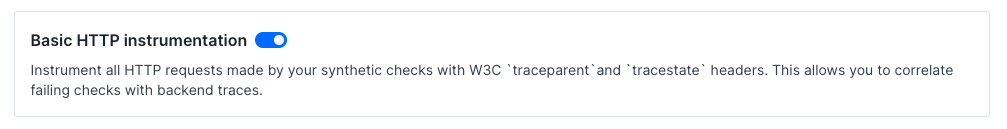
First, make sure to switch on the Basic HTTP Instrumentation. This will add the necessary headers to your HTTP requests.
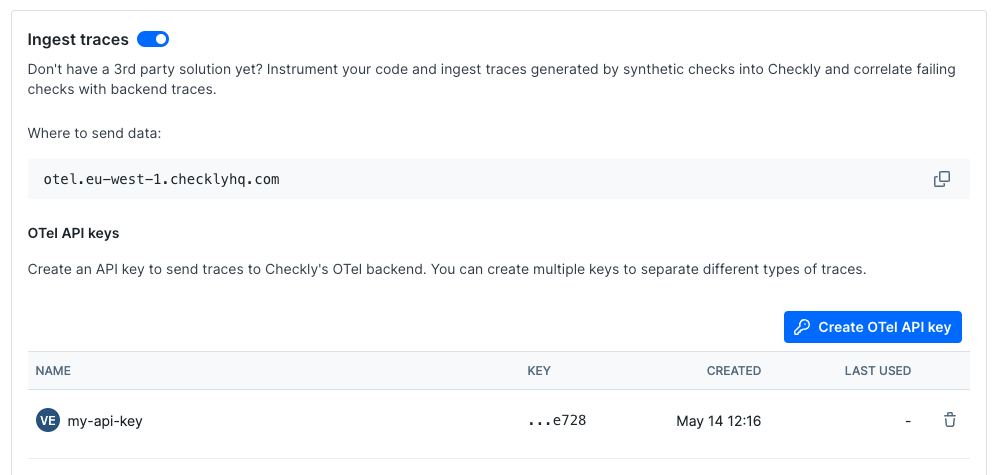
Then, flip on the “Ingest Traces” section, grab your OTel API key in the Ingest traces section of the Open Telemetry Integration page in the Checkly app and take a note of the endpoint for the region you want to use.
Now, export your API key in your shell by setting the OTEL_EXPORTER_OTLP_HEADERS environment variable.
export OTEL_EXPORTER_OTLP_HEADERS="authorization=Bearer <your-api-key>"
Next, export the endpoint for the region you want to use and give your service a name.
export OTEL_EXPORTER_OTLP_ENDPOINT="https://otel.eu-west-1.checklyhq.com"
export OTEL_SERVICE_NAME="your-service-name"
eu-west-1. We will expand to US regions soon.We are using the standard OpenTelemetry environment variables here to configure the OTLP exporter.
| Variable | Description |
|---|---|
OTEL_EXPORTER_OTLP_HEADERS |
The Authorization HTTP header containing your Checkly OTel API key as a Bearer token. |
OTEL_EXPORTER_OTLP_ENDPOINT |
The Checkly OTel API endpoint for the region you want to use. |
OTEL_SERVICE_NAME |
The name of your service to identify it among the spans in the web UI. |
Then start your app with the extra -r flag to load the tracing.js file before any other files are loaded. In this case
the index.js file holds your Express app and typically starts with code like:
// index.js
const express = require('express')
const PORT = process.env.PORT || '5555'
const app = express()
// etc.
node -r ./tracing.js index.js
🎉 You are done. Any interactions with your app that are triggered by a Checkly synthetic monitoring check will now generate traces, which are sent back to Checkly and displayed in the Checkly UI.
Reducing noise in the auto Node.js instrumentation
We found the Node.js auto-instrumentation a bit noisy. There can be a lot of file i/o and a ton of DNS calls you might not
be interested in. Luckily, you can easily tweak that by providing some extra options to the getNodeAutoInstrumentations() function.
We use the following configuration to filter out some of the noise:
instrumentations: [getNodeAutoInstrumentations({
  '@opentelemetry/instrumentation-fs': {
    enabled: false,
  },
  '@opentelemetry/instrumentation-net': {
    enabled: false,
  },
  '@opentelemetry/instrumentation-dns': {
    enabled: false,
  },
  '@opentelemetry/instrumentation-http': {
    enabled: true,
  },
})]
Last updated on May 14, 2024. You can contribute to this documentation by editing this page on Github